Compare Costs and Benefits of TW VISION LED Panels Against Traditional Displays
Companies evaluating display technologies must look beyond sticker price. Total cost of ownership, operational efficiency, visual performance, maintenance, and environmental impact all affect which solution best supports a use case. This article compares TW VISION LED panels with traditional display technologies (such as LCD video walls and projection systems) to give procurement managers, designers, and facilities teams a clear, practical framework for decisions.
Compare Costs and Benefits of TW VISION LED Panels Against Traditional Displays
Overview: Why comparison matters
Deciding between TW VISION LED panels and traditional displays is rarely a binary choice. TW VISION’s LED offerings are positioned as high-performance modular solutions optimized for brightness, seamless tiling, and long lifespans. Traditional options—LCD video walls, single large-format LCDs, and projectors—have their own strengths in initial cost, color accuracy in controlled environments, and familiar service ecosystems. A thorough comparison looks at capital expenditure (CapEx), operating expenditure (OpEx), lifecycle, image quality under various ambient conditions, and intangible benefits like brand perception and flexibility.
Capital Costs: Up?front investment and design
Initial cost differences are often the most visible. TW VISION LED panels commonly carry a higher per-square-foot price than commodity LCD displays or small-scale projectors, particularly at finer pixel pitches (P1.2–P2.5). But LED systems can reduce installation complexity for large-format or irregular-shaped displays since they are modular and can create seamless, large canvases without bezels.
Key factors affecting initial cost:
– Pixel pitch and native resolution (finer pitches are more expensive).
– Surface area and mounting complexity.
– Integrated electronics, control systems, and calibration services.
– Environmental rating (indoor vs outdoor, IP rating increases cost).
TW VISION often bundles calibration and modular replacement parts, which can raise CapEx but lower future maintenance headaches.
Operational Costs: Energy, maintenance, and downtime
Operating expenses typically favor LEDs over many traditional display technologies. Modern LED panels are more energy-efficient at comparable brightness levels and require fewer consumables (no lamps to replace, no filters). LEDs also maintain brightness more consistently over time, reducing the need for recalibration.
Considerations:
– Electricity consumption per square meter at specified brightness.
– Regular maintenance (cleaning, pixel replacement) and mean time between failures (MTBF).
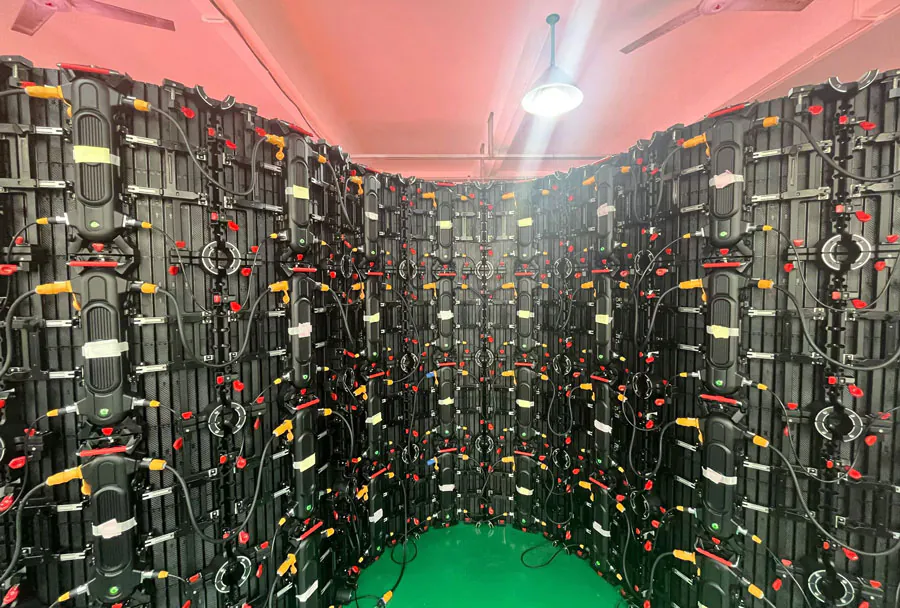
– Serviceability: modular LED tiles can be swapped quickly, minimizing downtime.
Traditional projectors require lamp replacement and alignment; LCDs can suffer from backlight degradation and more complex panel replacements.
Image Quality, Visibility, and Environment
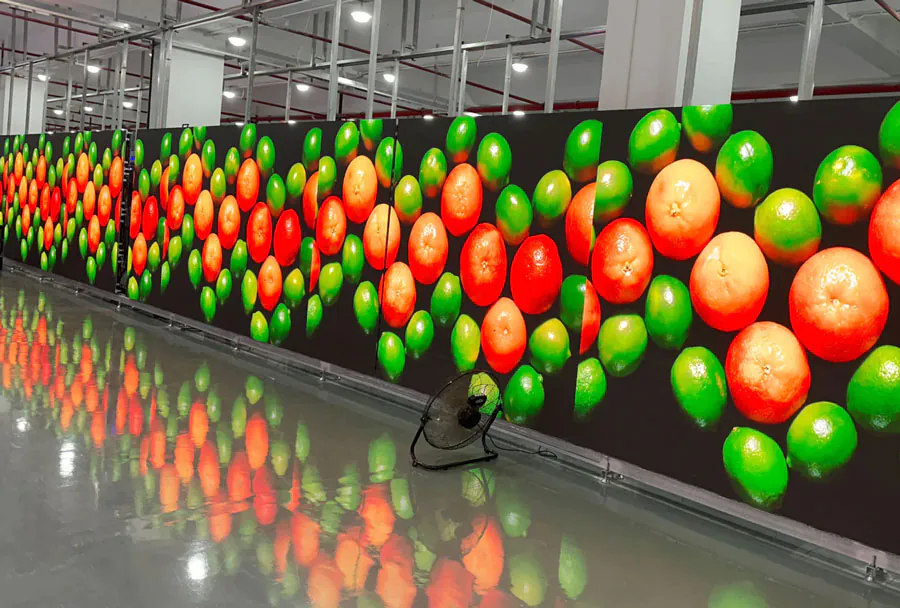
TW VISION LEDs excel in high ambient light settings due to inherently high peak brightness and no reliance on transmitted light. For outdoor signage, stadiums, retail windows, and bright atria, LED is often the only practical choice. In controlled, dim environments (e.g., some meeting rooms, home theaters), high-quality LCDs or projection systems can provide superior black levels and color depth at lower cost.
– HDR and contrast: direct-view LEDs have excellent dynamic range in many implementations; LCDs with local-dimming can be competitive.
– Viewing angles: LEDs typically offer wide, uniform viewing angles without color shift.
– Pixel pitch: For close viewing distances, fine-pitch LEDs (e.g., P1.2–P2.5) are required to avoid visible pixel structure; these increase cost.
Lifecycle and Return on Investment
Lifecycle analysis often reveals that higher initial investments in LED can be offset by lower running costs, reduced maintenance, longer usable life, and higher audience impact. For mission-critical displays (control rooms, transportation hubs, high-visibility retail), the ROI from improved uptime and performance can justify the premium.
Example ROI influences:
– Reduced electricity expense
– Lower replacement parts and labor
– Longer intervals between full-system refreshes
– Improved marketing conversion for retail due to superior visual impact
Analysis Table (Illustrative Comparison)
Below is an analysis table that summarizes key comparison points. Note: figures are illustrative; for procurement, obtain vendor quotes and site-specific energy/maintenance data.
| Criteria | TW VISION LED Panels (CapEx) | Traditional Displays (CapEx) | TW VISION LED Panels (OpEx / Benefits) | Traditional Displays (OpEx / Benefits) |
|---|---|---|---|---|
| Initial purchase cost (per sqm) | $2,500 – $6,000 (depends on pitch & IP rating) | $1,200 – $3,500 (LCD video wall / projection) | N/A | N/A |
| Power consumption (typical, W/sqm) | 200 – 450 W/sqm (depends on brightness) | 300 – 600 W/sqm (LCD + backlight / projector lamp) | Lower energy cost at equal brightness; less heat load | Higher energy cost; lamp/backlight replacements increase OpEx |
| Maintenance & service (annual) | 2–6% of CapEx (modular tile swaps, calibration) | 4–10% of CapEx (panel replacements, lamp swaps) | Fast module replacement reduces downtime | Potentially longer service windows; lamp disposal |
| Expected useful life | 70,000–100,000 hours (70k typical to half-brightness) | 50,000–80,000 hours (LCD backlight decline; projector lamps 2–4k hours) | Consistent brightness & color over time; reclaimable parts | Backlight/lamp degradation; more frequent replacements |
| Image performance (ambient light) | Excellent (high peak brightness, good visibility) | Good in controlled lighting; worse in bright sunlight | Better audience engagement in bright environments | May need shading/filters; lower perceived contrast outdoors |
Sample Total Cost of Ownership (TCO) Calculation — Illustrative
To make the comparison tangible, consider an illustrative 10 sqm installation over 7 years. Assumptions:
– TW VISION LED CapEx: $3,500/sqm → $35,000
– Traditional LCD video wall CapEx: $2,000/sqm → $20,000
– Energy consumption: LED 300 W/sqm; LCD 450 W/sqm
– Usage: 12 hours/day, 365 days/year
– Electricity: $0.12/kWh
– Annual maintenance: LED 4% of CapEx; LCD 7% of CapEx
– Major replacements: LCD requires backlight/panel refresh at year 4 ($5,000), projectors require repeated lamp changes (not modeled here)
Energy cost calculation over 7 years:
– LED: 300 W/sqm 10 sqm = 3,000 W = 3 kW → 3 kW 12 hr/day 365 7 = 91,530 kWh → $10,984
– LCD: 450 W/sqm 10 sqm = 4.5 kW → 4.5 kW 12 365 7 = 137,295 kWh → $16,476
Maintenance cost over 7 years (simple sum):
– LED: 4% $35,000 7 = $9,800
– LCD: 7% $20,000 7 = $9,800
Add replacement for LCD at year 4: +$5,000
Total 7-year cost:
– LED: $35,000 + $10,984 + $9,800 = $55,784
– LCD: $20,000 + $16,476 + $9,800 + $5,000 = $51,276
Interpretation: In this illustrative scenario, the LCD option shows slightly lower 7-year cost, but differences are narrow, and other non-modeled benefits of LED—reduced downtime, better visibility in daylight, improved marketing returns—can easily flip ROI. If electricity rates, operating hours, or replacement costs increase, LED’s advantage grows.
Use Cases Where TW VISION LED Panels Lead
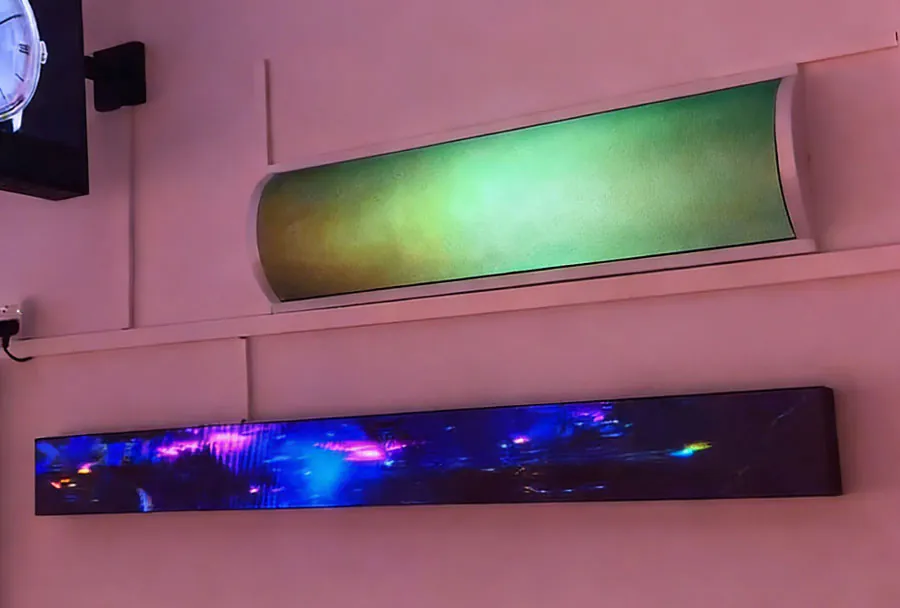
– Outdoor signage and digital billboards: high brightness and weatherproof options make LEDs the default.
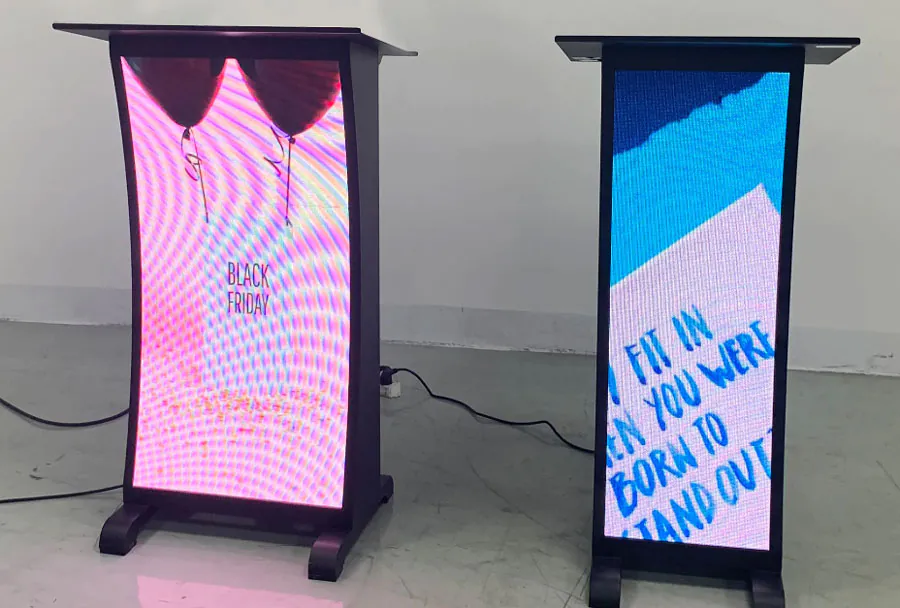
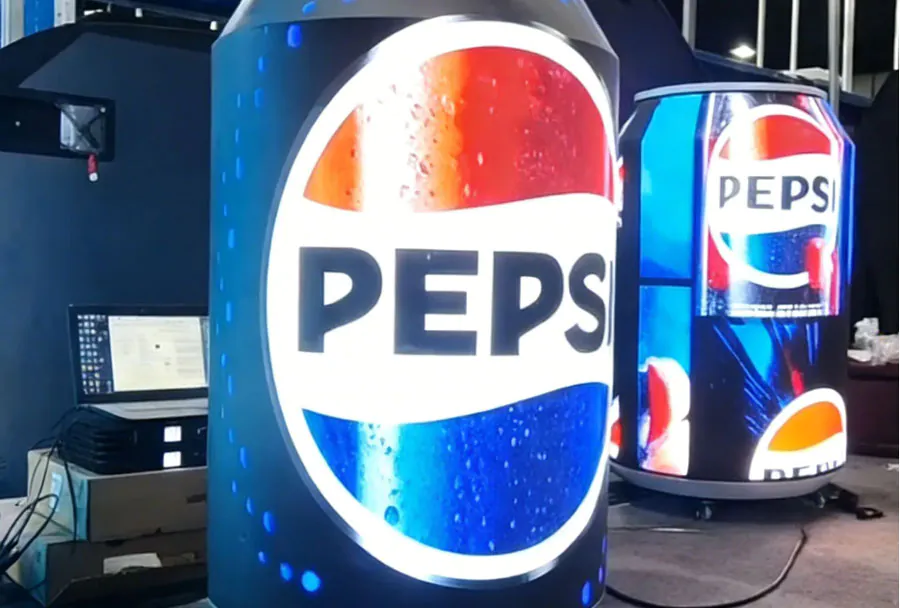
– Retail facades and experiential installations: seamless imagery and shape flexibility maximize impact.
– Control rooms and transportation hubs: high reliability and modularity reduce risk of single-panel failure.
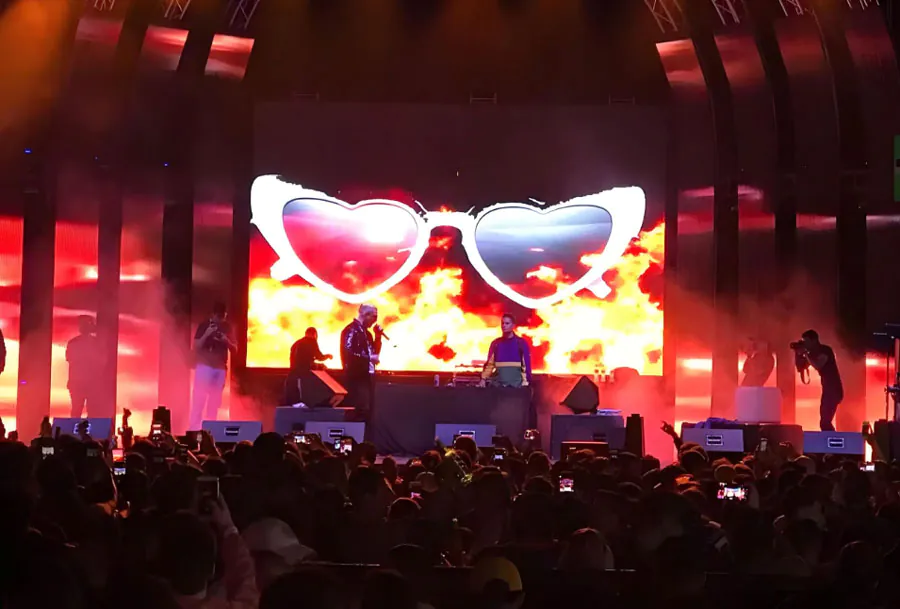
– Large events and arenas: scalable size, high brightness, and rapid assembly/disassembly.
Use Cases Where Traditional Displays May Be Preferable
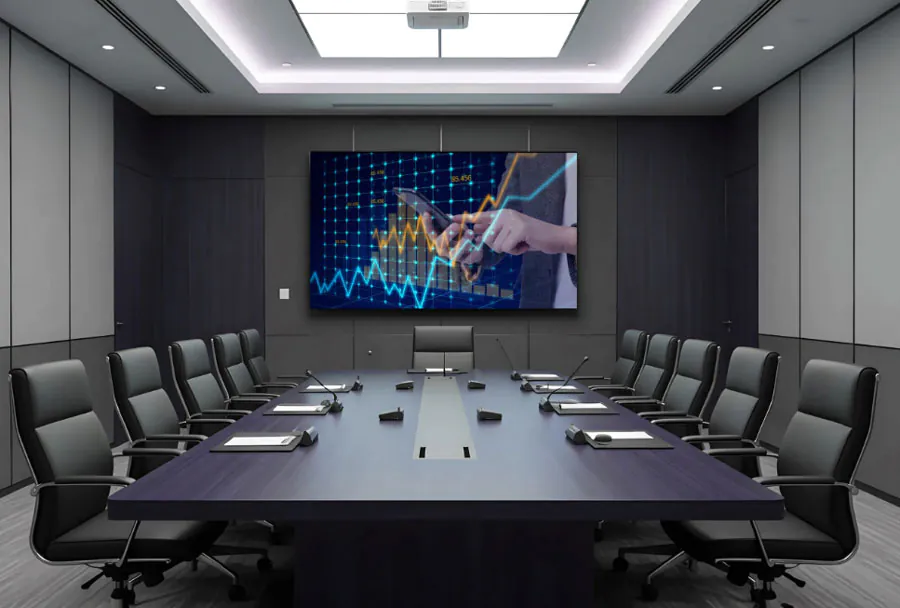
– Small meeting rooms and limited budgets: single large-format LCDs provide adequate quality at lower CapEx.
– Controlled-home theater or studio installations: projectors or OLED/LCD solutions may offer better black levels for lower cost.
– Environments with very close viewing distances where ultra-fine pixel pitch LED is cost-prohibitive.
Environmental and Regulatory Considerations
LED panels eliminate lamp disposal issues and tend to be more energy-efficient, reducing carbon footprint over the lifespan. However, LEDs use electronics and, when scaled large, may increase e-waste if not recycled properly. TW VISION and other suppliers increasingly provide take-back programs, spares, and modular designs that extend lifespan. For procurement, include end-of-life handling costs and check for supplier recycling programs.
Decision Framework and Recommendations
1. Define viewing distance and pixel-density requirements. If close viewing (<3 meters), verify pixel pitch affordability.
2. Model operational hours and local electricity costs. High daily usage favors LEDs.
3. Factor serviceability: how critical is uptime? If downtime is costly, prioritize modular, hot-swappable LED designs.
4. Evaluate environmental exposure: for any outdoor or high-ambient-light indoor use, LED should be the leading candidate.
5. Request site-specific quotes, including calibration, warranties, service level agreements (SLA), and replacement part pricing.
Final recommendation: For medium-to-large installations, high-visibility or outdoor use, and settings where uptime and audience impact are critical, TW VISION LED panels generally deliver superior long-term value despite higher CapEx. For small-scale, budget-constrained deployments in controlled lighting, traditional displays can still be cost-effective. Always run a site-specific TCO model using realistic local tariffs, usage patterns, and vendor terms to make a defensible procurement decision.
In conclusion, the choice between TW VISION LED panels and traditional displays is best made with a lifecycle mindset. LEDs tend to shift costs from ongoing operations to initial investment but deliver tangible benefits in performance, flexibility, and branding potential. When those benefits align with your organizational priorities—visibility, uptime, and environmental goals—the higher initial spend often pays dividends across the display’s lifecycle.