How to Evaluate LED Display Energy Consumption and Operating Costs


Evaluating LED Display Energy Consumption and Operating Costs starts with separating the display’s rated power from the electricity it actually uses during operation. A screen that draws 10 kW at full brightness may use far less over a full day if content, brightness, and scheduling reduce its average load.
Table of Contents
- 1. Separate Rated Power From Real-World Load
- What the specification should include
- Why maximum power can mislead
- 2. Measure the Display at Its Normal Operating Conditions
- Record more than watts
- Include the full electrical system
- 3. Convert Kilowatts Into Annual Electricity Cost
- Use a weighted operating schedule
- Check the tariff carefully
- Example calculation
- 4. Test Brightness, Content, Scheduling, and Climate Effects
- Variables that change consumption
- Build a test matrix
- 5. Compare Total Cost of Ownership, Not Just Energy Use
- Cost categories to compare
- Use a consistent evaluation period
- Can a solar system offset an LED display’s electricity use?
- Does turning off the video signal turn off the LED display?
- How should a curved or irregular display area be calculated?
- Are power-quality problems part of operating cost?
- Should display energy be treated as a business expense or a capital cost?
- Conclusion
The challenge is that manufacturers often publish maximum power, while owners pay for measured energy use, demand charges, maintenance, and cooling. Indoor and outdoor displays can also behave very differently because outdoor units often need higher brightness and stronger environmental protection.
This guide explains how to read technical specifications, measure real consumption, calculate annual electricity costs, account for brightness and operating schedules, and compare displays fairly. It also shows which measurements to record before approving a purchase or replacing an existing system.
1. Separate Rated Power From Real-World Load
The first step in How to Evaluate LED Display Energy Consumption and Operating Costs is distinguishing maximum power, average power, and measured power. These values answer different questions and should never be treated as interchangeable.
Maximum power is the highest electrical demand the display may reach under specified conditions. Average power estimates normal operation across typical content and brightness. Measured power comes from a meter and is the strongest basis for an operating-cost forecast.
A specification may list power in watts per square meter. To estimate the display’s maximum load, multiply that rating by the active display area:
`Maximum watts = watts per square meter × display area`
What the specification should include
Ask the supplier for:
– Maximum power consumption in W/m²
– Typical or average power consumption in W/m²
– Input voltage and phase requirements
– Refresh and brightness conditions used for testing
– Controller, receiving-card, and auxiliary power
– Recommended circuit capacity
– Power factor, if available
Power factor matters because some commercial electricity bills include demand or apparent-power considerations. A display drawing distorted or reactive current can require more electrical infrastructure than its simple wattage suggests.
Why maximum power can mislead
An LED display does not consume the same energy on every frame. Bright white content generally drives more LED emitters than dark content, while automatic brightness control can reduce output in low-light conditions.
The U.S. Department of Energy states that LED products “use at least 75% less energy” than incandescent lighting, but that comparison concerns lighting technology, not a complete video-display system. The display’s cabinet design, brightness setting, content, ventilation, and control equipment still determine its actual bill. See the U.S. Department of Energy LED lighting guidance for the source context.
How to apply this: Request both maximum and typical W/m² figures, then verify them with a power meter under representative content before comparing suppliers.
2. Measure the Display at Its Normal Operating Conditions
The most reliable way to apply How to Evaluate LED Display Energy Consumption and Operating Costs is to measure the complete system while it runs under normal conditions. A nameplate estimate is useful for electrical design, but a measured load is better for budgeting.
Use a true-RMS power analyzer or power-quality meter at the display’s supply point. Instruments from manufacturers such as Fluke are designed for electrical measurement and power-quality analysis; choose a model suitable for the installation’s voltage, phase, and current.
Record more than watts
A useful test log includes:
– Date and time
– Display brightness setting
– Content type
– Active area
– Voltage
– Current
– Real power in kW
– Power factor
– Operating temperature
– Whether ventilation or heating equipment is running
Test at least three content conditions:
– Mostly dark or low-light content
– Typical scheduled programming
– Bright, high-white-content material
One reading can hide major variation. A bright daytime advertisement may produce a different load from a dark nighttime playlist, even when both run for the same length of time.

Include the full electrical system
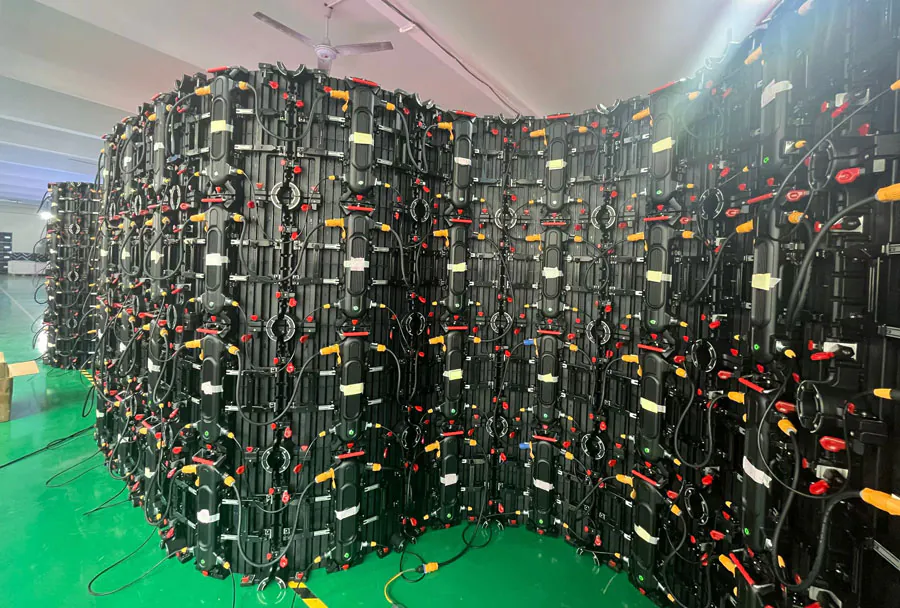
Measure more than the LED cabinets when possible. Include processors, media players, control computers, network equipment, cabinet fans, cooling equipment, and power supplies. If the display is installed in an enclosure, ventilation or air conditioning may become a material part of the operating cost.
A common scenario is a display that looks efficient at the cabinet level but has continuously operating auxiliary equipment. Measuring only one cabinet would understate the site’s actual energy use.
How to apply this: Perform a representative test during one normal daytime period and one low-brightness period, then calculate a time-weighted average rather than relying on a single peak reading.
3. Convert Kilowatts Into Annual Electricity Cost
A practical approach to How to Evaluate LED Display Energy Consumption and Operating Costs is converting measured power into kilowatt-hours and then applying the tariff. The core calculation is straightforward:
`Annual energy use = average kW × operating hours per day × operating days per year`
Then calculate electricity cost:
`Annual electricity cost = annual kWh × energy rate`
If the utility applies a demand charge, add that separately. Demand charges are typically based on the highest measured or billed demand during a defined interval, so reducing total hours may not eliminate the charge if the display still creates a high peak.
Use a weighted operating schedule
Suppose a display measures 6 kW during bright daytime operation and 2.5 kW at night. Instead of using 6 kW for every hour, calculate each schedule period separately:
– Daytime energy: `6 kW × daytime hours`
– Nighttime energy: `2.5 kW × nighttime hours`
– Standby energy: `standby kW × standby hours`
Add those periods to obtain daily kWh, then multiply by the number of operating days.
Check the tariff carefully
Your utility bill may contain several cost components:
– Energy charges per kWh
– Fixed customer charges
– Demand charges
– Time-of-use rates
– Taxes and regulatory fees
– Renewable-energy or delivery charges
A free spreadsheet is often enough for the first model. You can use Google Sheets to create separate cells for measured kW, operating hours, tariff periods, and annual escalation assumptions without hiding the calculation inside a black-box estimate.
Example calculation
A display averaging 4 kW for 12 hours per day over 365 days uses:
`4 × 12 × 365 = 17,520 kWh per year`
The final cost depends on the actual utility rate and any demand charge. Do not insert a national average rate when a site-specific bill is available.
How to apply this: Copy one recent utility bill, identify its energy and demand charges, and build a schedule-based calculation using measured—not maximum—power.
4. Test Brightness, Content, Scheduling, and Climate Effects
The most useful way to apply How to Evaluate LED Display Energy Consumption and Operating Costs is to test the operating conditions that influence load. Brightness is important, but it is only one variable.
Outdoor displays often need higher brightness during daylight and lower brightness after sunset. Automatic brightness control can reduce unnecessary output, but it should be configured carefully so the screen remains readable and compliant with local rules.
Variables that change consumption
Evaluate these factors separately:
– Brightness limits by time of day
– White-heavy versus dark content
– Video frame composition
– Static images versus animated content
– Automatic brightness sensor settings
– Cabinet ventilation and fan operation
– Heating or condensation-control equipment
– Standby behavior outside scheduled hours
Content can also affect thermal conditions. A bright, continuously active display may increase internal heat, which can cause fans or cooling equipment to operate more often.
Build a test matrix
A simple test matrix can compare:
| Test condition | What it reveals | Action to take |
|---|---|---|
| Maximum brightness | Electrical and circuit peak | Size infrastructure |
| Normal daytime content | Typical daytime load | Use in budget model |
| Night brightness | After-dark savings potential | Set a safe schedule |
| Dark content | Lower-load baseline | Review content standards |
| Standby mode | Off-hours draw | Enable verified sleep settings |
| Hot-weather operation | Cooling or fan impact | Include seasonal costs |
Do not assume that a lower brightness setting always produces the same proportional reduction in electricity use. The result depends on the display’s control system, power-supply efficiency, and content.
A common mistake is scheduling the video content to stop while leaving the cabinets, processors, or ventilation powered continuously. The screen may appear inactive while still drawing measurable standby power.
How to apply this: Measure each row in the test matrix, save the readings with the corresponding settings, and use the results to create a brightness and shutdown policy.
5. Compare Total Cost of Ownership, Not Just Energy Use
A complete approach to How to Evaluate LED Display Energy Consumption and Operating Costs includes purchase price, installation, maintenance, replacement parts, energy, and end-of-life costs. The display with the lowest W/m² rating is not automatically the cheapest system to own.
Cost categories to compare
Include:
– Display modules and cabinets
– Sending cards, processors, and media players
– Structural supports and electrical work
– Installation labor and access equipment
– Energy consumption
– Demand and time-of-use charges
– Cleaning and inspection
– Module, power-supply, and receiving-card replacement
– Warranty coverage and response time
– Software or content-management fees
– Removal and disposal
Ask suppliers to state whether their consumption figure includes the entire signal chain or only the LED cabinets. Also confirm whether the warranty covers brightness degradation, power supplies, fans, and weather-related failures.
Use a consistent evaluation period
A five-year or seven-year ownership model can be useful, but the correct period depends on the project’s expected life and financing. Keep assumptions visible and run sensitivity tests for:
– Higher electricity prices
– Longer operating hours
– More frequent repairs
– Increased daytime brightness
– Cooling or heating requirements
– Different replacement cycles
Do not present uncertain future prices as guaranteed savings. Instead, show a low, expected, and high case using clearly labeled assumptions.
The same process used in How to Evaluate LED Display Energy Consumption and Operating Costs also helps compare LED with alternatives such as LCD video walls or projection. Compare usable brightness, outdoor performance, maintenance access, installation constraints, and energy—not wattage alone.
How to apply this: Create a five-year ownership spreadsheet with one row for every cost category, then request identical assumptions from each supplier before ranking the bids.
Frequently Asked Questions About How to Evaluate LED Display Energy Consumption and Operating Costs
Can a solar system offset an LED display’s electricity use?
Yes, but the solar design must account for the display’s operating schedule, local solar resource, battery needs, and grid rules. A site may generate substantial energy during daylight while the display operates after sunset, creating a timing mismatch.
When applying How to Evaluate LED Display Energy Consumption and Operating Costs, compare hourly generation with hourly demand rather than comparing annual totals alone. Confirm interconnection and export rules with the utility.
Does turning off the video signal turn off the LED display?
Not necessarily. Some systems stop displaying content but leave cabinet power supplies, processors, fans, and network devices energized. This can create measurable overnight consumption. When using How to Evaluate LED Display Energy Consumption and Operating Costs, check the electrical meter after content playback stops and again after the cabinets enter verified standby.
Ask the integrator whether remote power control is supported and whether repeated cycling affects the warranty.
How should a curved or irregular display area be calculated?
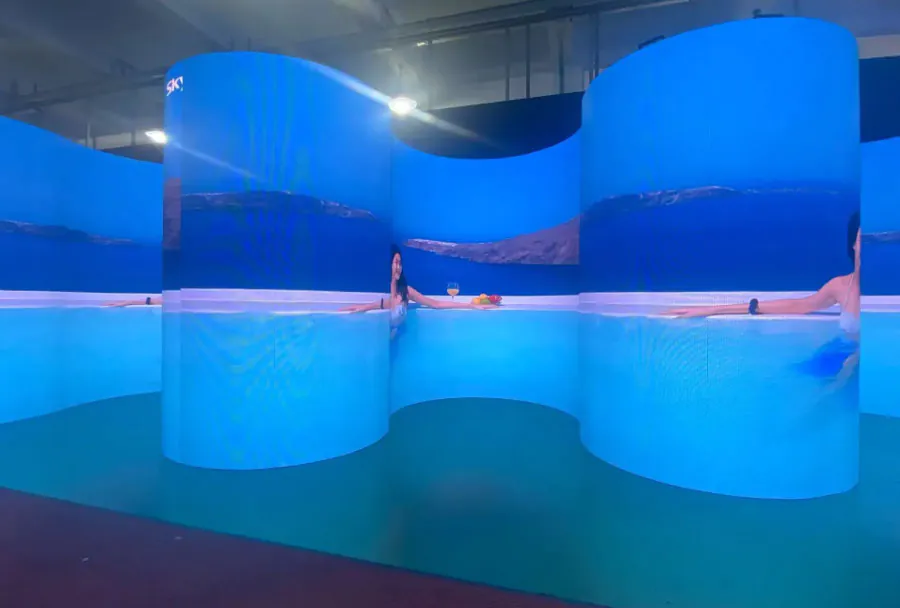
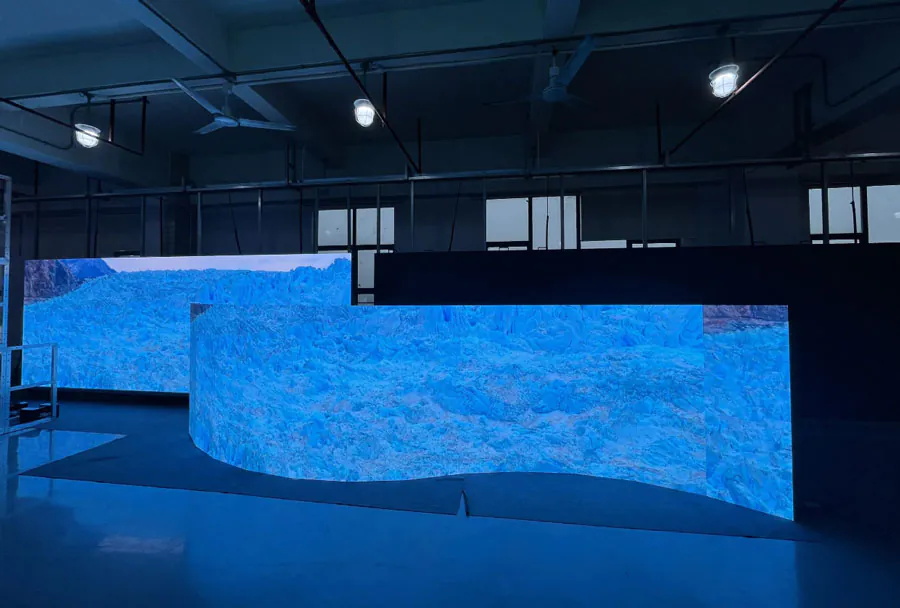
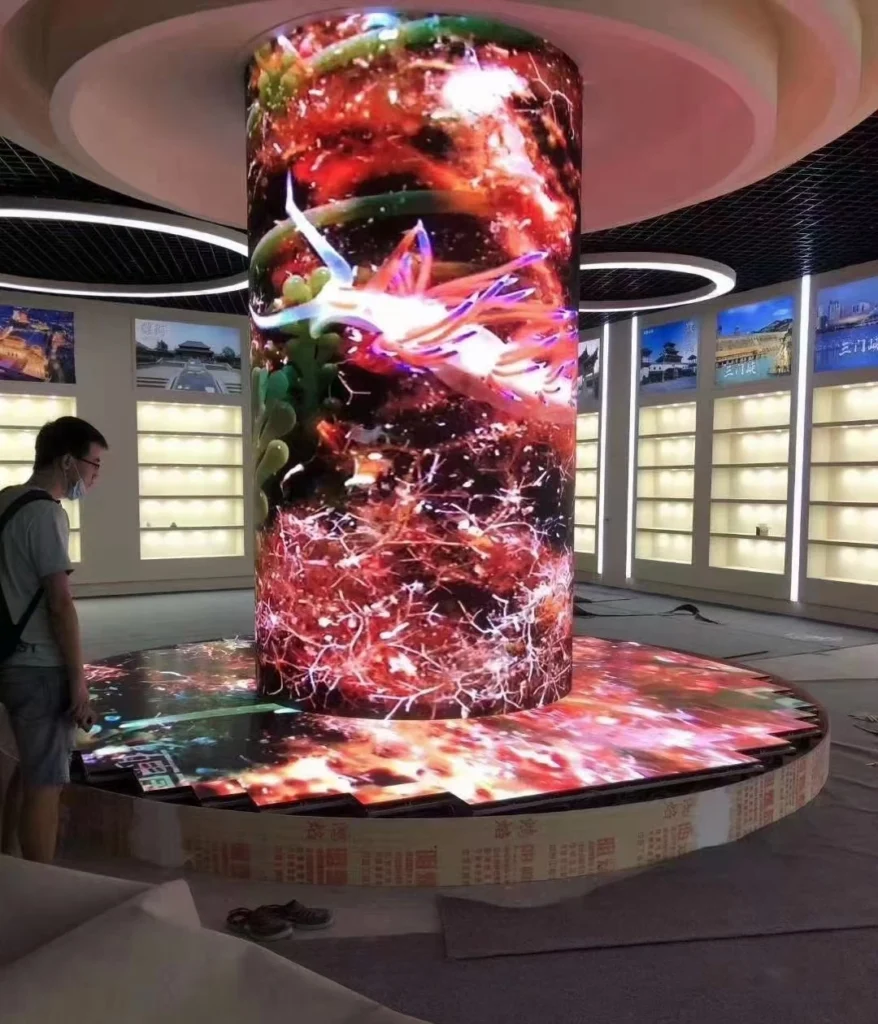
Measure the actual active LED area, not the supporting frame or nominal cabinet footprint. Curved installations may also require different cabinet layouts, ventilation paths, and power-distribution designs. For How to Evaluate LED Display Energy Consumption and Operating Costs, obtain cabinet-level dimensions and sum the active areas before applying W/m² specifications.
If the shape includes gaps or non-LED sections, exclude those areas from the display calculation.

Are power-quality problems part of operating cost?
They can be. Poor power factor, voltage imbalance, harmonics, loose connections, or undersized distribution equipment may increase losses, maintenance risk, or demand-related charges. During How to Evaluate LED Display Energy Consumption and Operating Costs, have a qualified electrician review voltage, current, phase balance, and power factor under load.
A display can meet its wattage estimate while still requiring corrective electrical work.
Should display energy be treated as a business expense or a capital cost?
Electricity is usually an operating expense, while the display and installation are generally capital items, but accounting treatment depends on jurisdiction and company policy. The distinction matters when comparing payback, depreciation, and project approval.
Use How to Evaluate LED Display Energy Consumption and Operating Costs to produce separate capital and operating totals, then have your accountant confirm tax and reporting treatment for the specific installation.
Conclusion
Accurate display costing depends on measured operating behavior, not a single manufacturer specification. The strongest evaluation combines electrical testing, a realistic operating schedule, the correct utility tariff, and a full ownership model.
– Separate maximum, average, and measured power.
– Include controllers, ventilation, cooling, and standby equipment.
– Test brightness and content conditions that reflect real use.
– Compare maintenance and infrastructure costs alongside electricity.
How to Evaluate LED Display Energy Consumption and Operating Costs becomes much easier when you create a documented baseline before purchasing or changing settings. Start by measuring the complete system, exporting the utility tariff, and building a schedule-based spreadsheet. Then ask every supplier to quote against the same assumptions so your final decision reflects total cost rather than headline wattage.
Related Articles
- Energy-Efficient LED Display: 8 Easy Secrets That Work
- Outdoor LED Screen Atlanta: 15 : A Complete Buying Guide
- Outdoor LED Screen Houston: Buy, Rent, Install: Expert Guide
- how to buy LED Screen in Houston: 3 : Complete Buying Guide – LED DISPLAY MANUFACTURE TW VISION