Large LED Screen Clarity at Different Viewing Distances

Large LED Screen Clarity at Different Viewing Distances: A Practical Acceptance Test turns a subjective judgment—“the screen looks clear”—into a repeatable inspection with documented results. One useful fact is that an observer with normal visual acuity can resolve detail near one minute of arc, so a 2.6 mm pixel pitch approaches that angular size at roughly 8.9 meters.
Table of Contents
- 1. Define the Viewing Positions and Pass Criteria
- Map the actual viewing zone
- Convert pixel pitch into angular size
- 2. Check Pixel Structure, Scaling, and Fine Detail
- Use pitch as a planning benchmark
- Test the complete signal path
- 3. Measure Brightness, Black Level, and Uniformity
- Measure rather than photograph
- Test in operating light
- 4. Inspect Grayscale, Color, and Real Content
- Use diagnostic patterns first
- Finish with representative material
- 5. Verify Motion, Seams, Processing, and Sign-Off
- Examine motion at multiple speeds
- Record seams and configuration
- How should an outdoor LED screen be tested during changing daylight?
- What changes when testing a curved or corner LED wall?
- Can a screen pass for spectators but fail for television cameras?
- How should dead or stuck pixels be handled near cabinet boundaries?
- What should happen if only one audience area fails?
- Conclusion
The challenge is that pixel pitch alone cannot prove acceptable image quality. Scaling, brightness, color processing, cabinet alignment, ambient light, motion handling, and source quality can all change what viewers see.
A reliable test therefore uses representative content, defined audience positions, controlled settings, and recorded measurements. The five checks below cover viewing geometry, pixel visibility, luminance uniformity, grayscale and color, motion, seams, and final documentation. They can be used for indoor auditoriums, retail displays, outdoor signs, control rooms, and event installations.
1. Define the Viewing Positions and Pass Criteria
A valid acceptance test starts by identifying where real viewers will stand or sit. Testing from one convenient position can hide problems visible from front-row seats, side angles, or the farthest audience area.
Map the actual viewing zone
Mark at least three positions:
– Nearest normal position: The closest place where content is intended to be viewed
– Typical position: The location occupied by most viewers
– Farthest critical position: The most distant seat requiring readable content
Large LED Screen Clarity at Different Viewing Distances: A Practical Acceptance Test should also define off-axis positions when the audience extends beyond the display’s centerline.
Convert pixel pitch into angular size
The NCBI Bookshelf chapter on visual acuity explains that normal visual resolution is commonly associated with approximately one minute of arc. Using that reference, the distance at which one pixel subtends one arcminute can be estimated as:
`Distance in meters ≈ pixel pitch in millimeters ÷ tan(1 arcminute) ÷ 1,000`
This simplifies to approximately `3.44 × pixel pitch in millimeters`. It is a geometry benchmark, not a guaranteed minimum viewing distance, because contrast, eyesight, content, and processing affect perception.
Record contractual limits before testing, including permitted dead pixels, visible seams, color variation, brightness variation, and text legibility. Do not create pass limits after defects are discovered.
How to apply this: Mark your nearest, typical, farthest, and side-view positions on a floor plan before running Large LED Screen Clarity at Different Viewing Distances: A Practical Acceptance Test.
2. Check Pixel Structure, Scaling, and Fine Detail
Pixel clarity passes when intended content remains readable without distracting pixel structure, aliasing, or scaling artifacts. Begin with native-resolution patterns before evaluating videos or presentation slides.
Use pitch as a planning benchmark
The following values are calculated from the one-arcminute geometry described above. They indicate where individual pixels may become difficult for an observer with normal visual acuity to resolve under favorable conditions.
| Pixel pitch | One-arcminute distance | What to check |
|---|---|---|
| 1.5 mm | 5.2 m | Fine text and moiré |
| 2.6 mm | 8.9 m | Pixel visibility |
| 3.9 mm | 13.4 m | Diagonal edges |
| 6.0 mm | 20.6 m | Coarse structure |
These distances are not universal pass/fail rules. A viewer can notice cabinet seams, color mismatch, or jagged graphics even when individual pixels are no longer obvious.
Test the complete signal path
Display one-pixel horizontal and vertical lines, a checkerboard, small text, diagonal lines, and circles. Confirm that the media server or scaler sends the wall’s mapped canvas without unintended stretching, cropping, sharpening, or overscan.
Large LED Screen Clarity at Different Viewing Distances: A Practical Acceptance Test should compare the source file, processor output, and displayed image. A 3,840-pixel-wide source does not provide native detail if the configured LED canvas is substantially smaller or incorrectly mapped.
Consider a logo with a one-pixel outline. If the outline disappears or becomes uneven, the cause may be scaling rather than insufficient pixel density.
How to apply this: Load native-resolution line, text, and checkerboard patterns, then repeat Large LED Screen Clarity at Different Viewing Distances: A Practical Acceptance Test from every marked audience position.
3. Measure Brightness, Black Level, and Uniformity
Clarity requires enough luminance contrast for content to remain distinct under the site’s real ambient lighting. Maximum brightness alone does not prove that a screen is uniform, comfortable, or capable of preserving shadow detail.
Measure rather than photograph
Use a calibrated luminance meter or colorimeter aimed at the display. A general illuminance meter reports light falling on a surface in lux, while display luminance is normally evaluated in candelas per square meter.
Take readings from at least nine zones: the four corners, four edge centers, and screen center. For a basic uniformity calculation, divide the lowest reading by the highest reading and multiply by 100; compare the result with the project’s specified tolerance.
The Society for Information Display’s International Committee for Display Metrology publishes the Information Display Measurements Standard, which provides standardized approaches for measuring display performance. This supports using defined patterns, geometry, and instrument conditions rather than visual impressions alone.
Test in operating light
Run Large LED Screen Clarity at Different Viewing Distances: A Practical Acceptance Test under the lighting conditions expected during use. Evaluate full white, full black, low gray, and representative content without changing settings between viewing positions.
Calman is display-calibration software used with compatible measurement instruments to evaluate luminance, grayscale, gamma, and color. Record the software version, meter, test pattern, and LED processor settings.
How to apply this: Measure the same nine screen zones under normal site lighting and attach the readings to your Large LED Screen Clarity at Different Viewing Distances: A Practical Acceptance Test record.
4. Inspect Grayscale, Color, and Real Content
A screen passes color inspection when neutral tones, gradients, and key brand colors remain consistent across cabinets and viewing positions. Bright test images can conceal crushed blacks, tinted grays, banding, and low-level module differences.
Use diagnostic patterns first
Display low-gray fields, grayscale ramps, red, green, blue, cyan, magenta, yellow, and white. An 8-bit signal nominally provides 256 code values per channel, while a 10-bit signal provides 1,024; however, the complete source-to-screen chain must preserve the higher bit depth for smoother gradients.
Look for:
– Color tint in nominally neutral gray
– Abrupt steps in smooth gradients
– Dark cabinets visible in low-gray fields
– Oversaturated highlights that lose detail
– Uneven white balance between modules
– Shadow detail disappearing near black
Large LED Screen Clarity at Different Viewing Distances: A Practical Acceptance Test should use the final processor configuration, brightness level, color space, and content playback system. A wall calibrated through a temporary laptop input may behave differently after the permanent signal chain is connected.
Finish with representative material
Use one approved clip or image for each critical content type, such as small presentation text, faces, sports motion, dark scenes, or brand graphics. Do not judge calibration from highly compressed online video because compression artifacts can resemble display faults.
A common scenario is a corporate logo that matches near the center but shifts color at side seats. That points to an angular color-consistency issue rather than a source-file error.
How to apply this: Save a fixed pattern-and-content playlist and use it unchanged whenever you repeat Large LED Screen Clarity at Different Viewing Distances: A Practical Acceptance Test.
5. Verify Motion, Seams, Processing, and Sign-Off
Final acceptance should confirm that the assembled wall performs correctly with moving content and operational settings. Static charts cannot reveal scan artifacts, motion breakup, synchronization faults, or cabinet movement.
Examine motion at multiple speeds
Play horizontal and vertical pans, scrolling text, fast subject movement, and low-frame-rate content. Watch for tearing, judder, ghosting, edge breakup, intermittent tiles, and differences between cabinets.
A camera can help identify refresh-related bands, but its shutter and frame rate can create artifacts that people do not see. Separate human-viewing acceptance from on-camera acceptance, especially for broadcast studios and virtual-production stages.
If the wall uses a Brompton processor, Brompton Technology provides LED processing and calibration systems with controls for panel mapping, color, synchronization, and related display parameters. Other processor ecosystems require equivalent settings to be documented rather than assumed.
Record seams and configuration
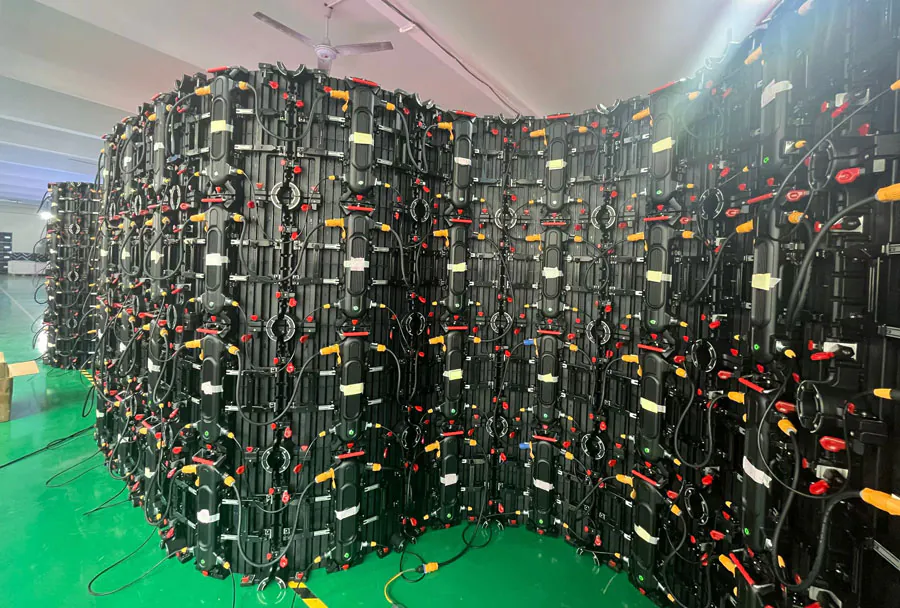
Inspect cabinet boundaries with full white, low gray, and moving diagonal lines. Measure or photograph raised modules, gaps, rotated cabinets, and brightness discontinuities from a fixed reference position.
Run Large LED Screen Clarity at Different Viewing Distances: A Practical Acceptance Test only after saving the operational configuration. Your report should identify the source resolution, frame rate, processor file, firmware version, brightness setting, test date, viewing positions, failed observations, and corrective actions.
Recheck repaired modules with the original content and settings. Changing brightness or calibration between the initial test and retest invalidates a direct comparison.
How to apply this: Export the final processor configuration and require both parties to sign the completed Large LED Screen Clarity at Different Viewing Distances: A Practical Acceptance Test report.
Frequently Asked Questions About Large LED Screen Clarity at Different Viewing Distances: A Practical Acceptance Test
How should an outdoor LED screen be tested during changing daylight?
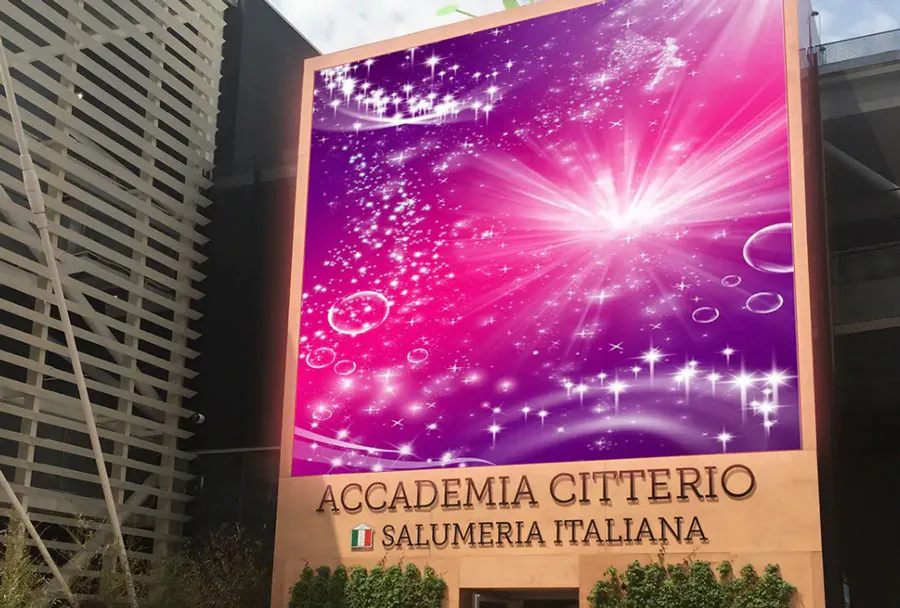
Test it during representative bright and dark operating periods because ambient contrast can change substantially throughout the day. Large LED Screen Clarity at Different Viewing Distances: A Practical Acceptance Test should use the scheduled day and night brightness profiles rather than leaving the display at maximum output.
If automatic brightness control is installed, record the sensor location and displayed luminance when each profile activates so later changes can be traced.
What changes when testing a curved or corner LED wall?
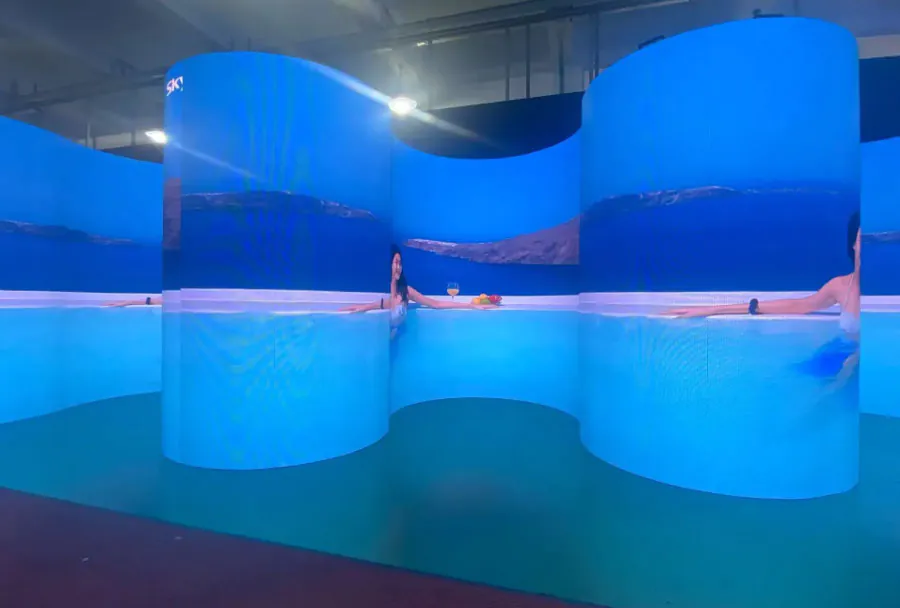
Use viewing positions across the full arc because distance, angle, and cabinet orientation change from seat to seat. Large LED Screen Clarity at Different Viewing Distances: A Practical Acceptance Test should pay particular attention to text crossing corners and to color shifts near extreme angles.
On a faceted curve, a mechanically correct installation may still produce visible brightness bands where adjoining cabinets face the audience at different angles.
Can a screen pass for spectators but fail for television cameras?
Yes. A display can look stable to people yet show scan lines, rolling bands, moiré, or color differences on camera. Large LED Screen Clarity at Different Viewing Distances: A Practical Acceptance Test for broadcast use needs the production camera models, planned shutter settings, frame rates, and representative lenses.
Genlock, processor synchronization, scan mode, and camera angle may need adjustment even when the audience-facing visual test passes.
How should dead or stuck pixels be handled near cabinet boundaries?
Classify each defect by location, color, behavior, and visibility instead of recording only a total count. Large LED Screen Clarity at Different Viewing Distances: A Practical Acceptance Test should distinguish an isolated failed subpixel from a cluster or repeating boundary fault.
A single defect near a high-contrast logo may be more disruptive than several defects in a peripheral area, so the purchase specification should define both quantities and critical zones.
What should happen if only one audience area fails?
Document the failing position and determine whether it is part of the contracted viewing zone. Large LED Screen Clarity at Different Viewing Distances: A Practical Acceptance Test may reveal an obstruction, severe side angle, local glare source, or pixel visibility issue limited to a front row.
Possible remedies include relocating seats, changing content size, correcting lighting, adjusting screen geometry, or replacing the display design when the position is operationally essential.
Conclusion
A defensible LED screen inspection connects objective measurements with what viewers actually see. Large LED Screen Clarity at Different Viewing Distances: A Practical Acceptance Test should leave you with repeatable evidence, not a verbal assurance that the wall “looks fine.”
Key actions are:
– Mark the nearest, typical, farthest, and off-axis viewing positions.
– Test native-resolution patterns before judging normal content.
– Measure luminance and uniformity under operating light.
– Save processor settings, results, photographs, and corrective actions.
Pixel-pitch formulas are useful planning tools, but they cannot replace on-site checks for scaling, seams, color, motion, and ambient contrast. Build a fixed test playlist, prepare a measurement sheet, and agree on acceptance limits before commissioning begins.
Then perform the five checks with the permanent source and processor chain, correct every documented failure, and repeat the same test before signing off.
Related Articles
- Virtual Production LED Wall Acceptance Testing: What Buyers Should Verify Before Delivery
- Custom LED Display Integration: Who Is Responsible When Components Come from Different Suppliers?
- How to Test LED Display Viewing Angle Before Buying: 5 Best